ammistability computes multiple stability parameters from an AMMI
model. Further, the corresponding Simultaneous Selection Indices for Yield
and Stability (SSI) are also calculated according to the argument
ssi.method. From the results, correlation between the computed indices
will also be computed. The resulting correlation matrices will be plotted as
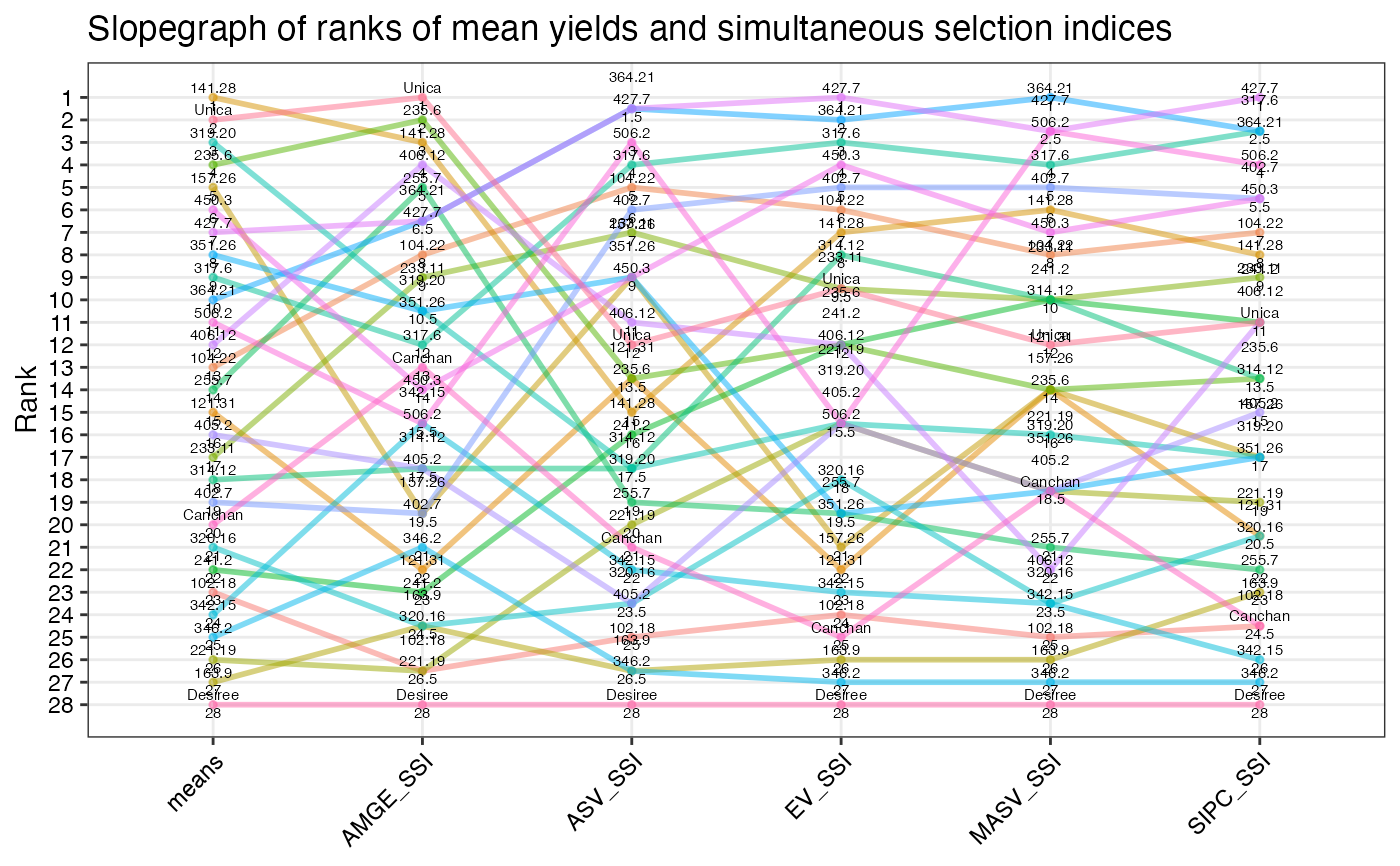
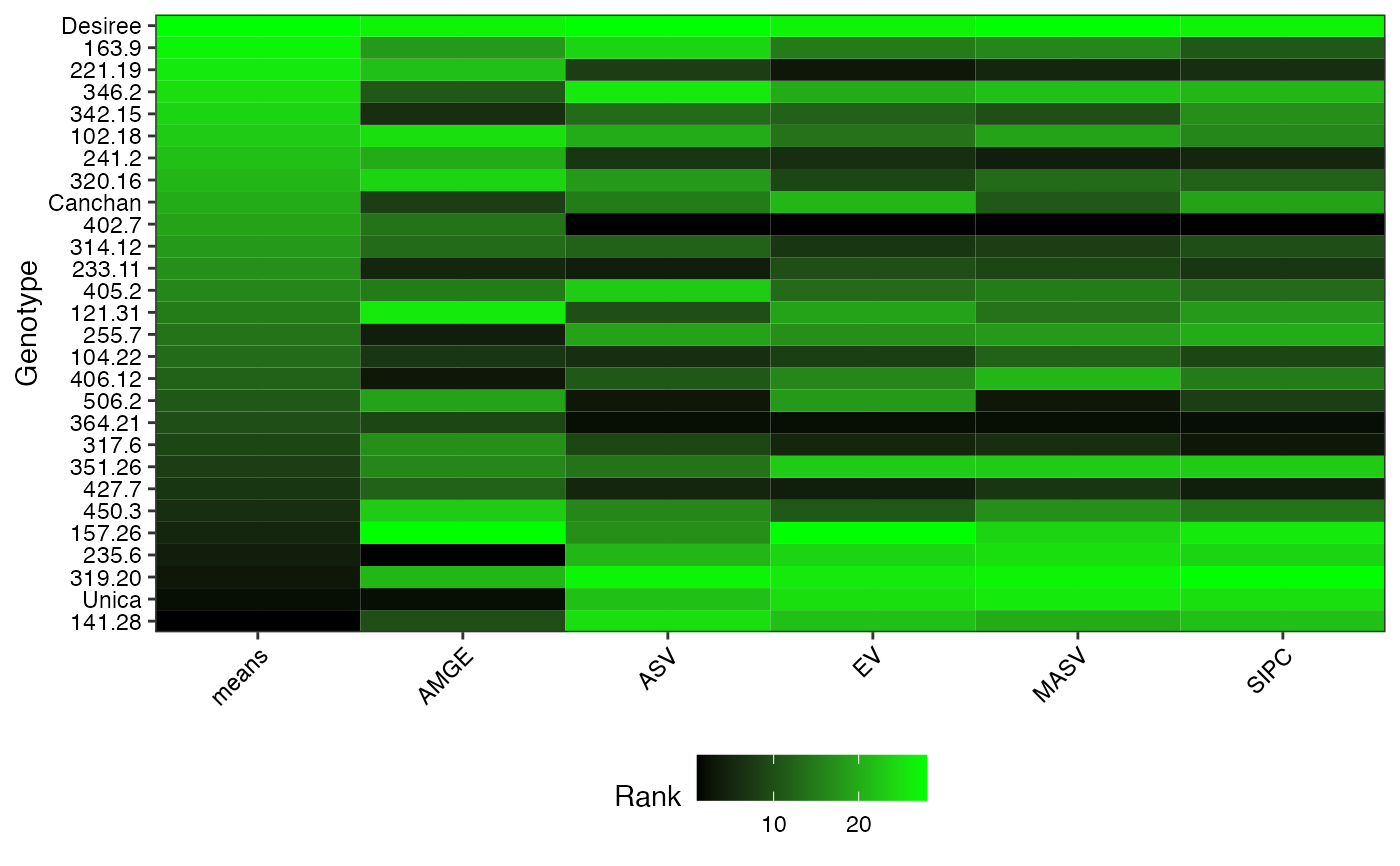
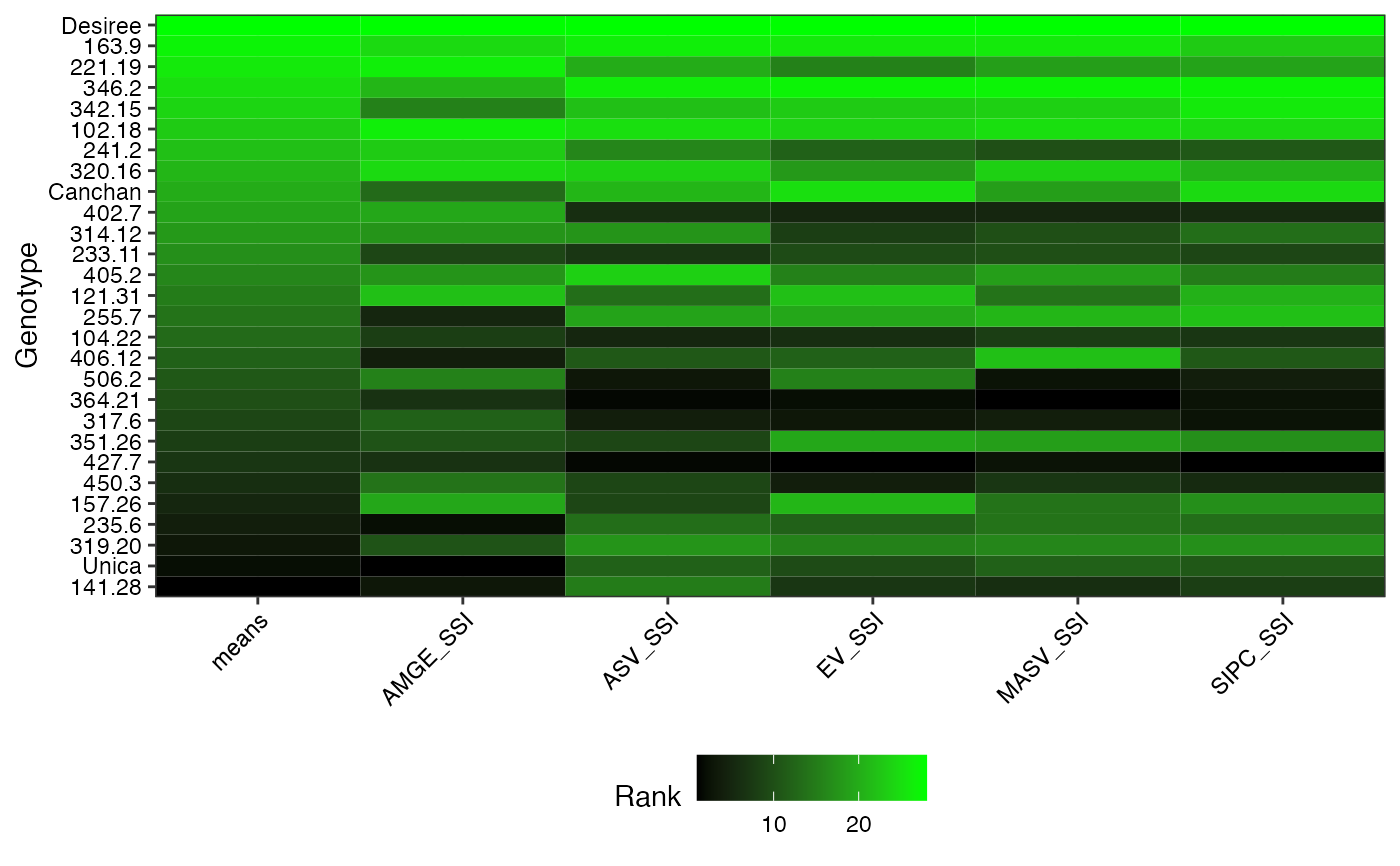
correlograms. For visual comparisons of ranks of genotypes for different
indices, slopegraphs and heatmaps will also be generated by this function.
Usage
ammistability(
  model,
  n,
  alpha = 0.05,
  ssi.method = c("farshadfar", "rao"),
  a = 1,
  AMGE = TRUE,
  ASI = TRUE,
  ASV = TRUE,
  ASTAB = TRUE,
  AVAMGE = TRUE,
  DA = TRUE,
  DZ = TRUE,
  EV = TRUE,
  FA = TRUE,
  MASI = TRUE,
  MASV = TRUE,
  SIPC = TRUE,
  ZA = TRUE,
  force.grouping = TRUE,
  line.size = 1,
  line.alpha = 0.5,
  line.col = NULL,
  point.size = 1,
  point.alpha = 0.5,
  point.col = NULL,
  text.size = 2
)
Arguments
- model
The AMMI model (An object of class
AMMIgenerated byAMMI).- n
The number of principal components to be considered for computation. The default value is the number of significant IPCs.
- alpha
Type I error probability (Significance level) to be considered to identify the number of significant IPCs.
- ssi.method
The method for the computation of simultaneous selection index. Either
"farshadfar"or"rao"(SeeSSI).- a
The ratio of the weights given to the stability components for computation of SSI when
method = "rao"(SeeSSI).- AMGE
If
TRUE, computes AMGE (see Details). Default isTRUE.- ASI
If
TRUE, computes ASI (see Details).n = 2will be used in this case. Default isTRUE.- ASV
If
TRUE, computes ASV (see Details).n = 2will be used in this case. Default isTRUE.- ASTAB
If
TRUE, computes ASTAB (see Details). Default isTRUE.- AVAMGE
If
TRUE, computes AVAMGE (see Details). Default isTRUE.- DA
If
TRUE, computes DA (see Details). Default isTRUE.- DZ
If
TRUE, computes DZ (see Details). Default isTRUE.- EV
If
TRUE, computes EV (see Details). Default isTRUE.- FA
If
TRUE, computes FA (see Details). Default isTRUE.- MASI
If
TRUE, computes MASI (see Details). Default isTRUE.- MASV
If
TRUE, computes MASV (see Details). Default isTRUE.- SIPC
If
TRUE, computes SIPC (see Details). Default isTRUE.- ZA
If
TRUE, computes ZA (see Details). Default isTRUE.- force.grouping
If
TRUE, genotypes will be considered as a grouping variable for plotting the slopegraphs. (Each genotype will be represented by a different colour in the slopegraphs). Default isTRUE.- line.size
Size of lines plotted in the slopegraphs. Must be numeric.
- line.alpha
Transparency of lines plotted in the slopegraphs. Must be numeric.
- line.col
Default is
TRUE. Overrides colouring byforce.groupingargument.- point.size
Size of points plotted in the slopegraphs. Must be numeric.
- point.alpha
Transparency of points plotted in the slopegraphs. Must be numeric.
- point.col
Default is
TRUE. Overrides colouring byforce.groupingargument.- text.size
Size of text annotations plotted in the slopegraphs. Must be numeric.
Value
A list with the following components:
- Details
A data frame indicating the stability parameters computed and the method used for computing the SSI.
- Stability Parameters
A data frame of computed stability parameters.
- Simultaneous Selection Indices
A data frame of computed SSIs.
- SP Correlation
A data frame of correlation between stability parameters.
- SSI Correlation
A data frame of correlation between SSIs.
- SP and SSI Correlation
A data frame of correlation between stability parameters and SSIs.
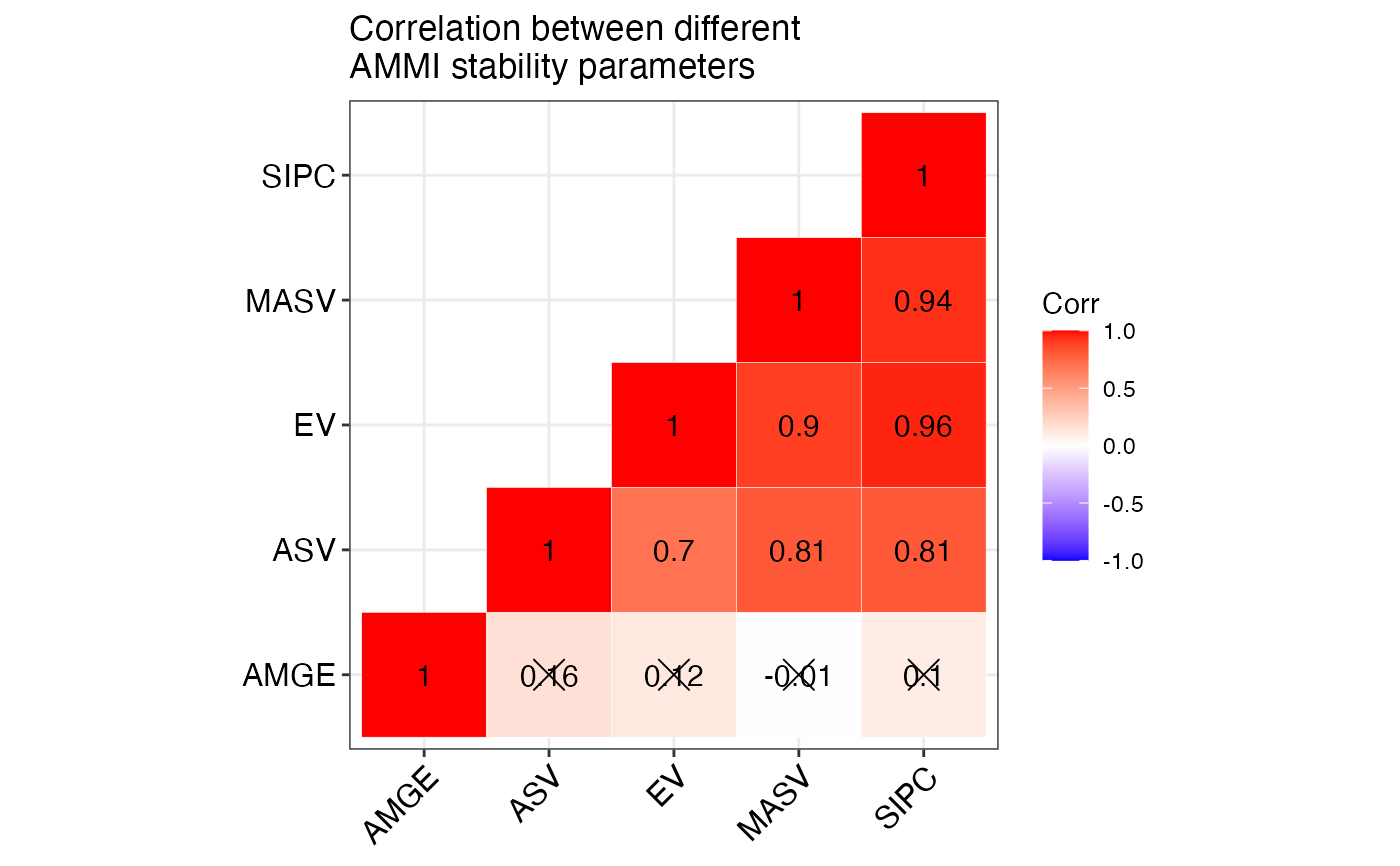
- SP Correlogram
Correlogram of stability parameters.
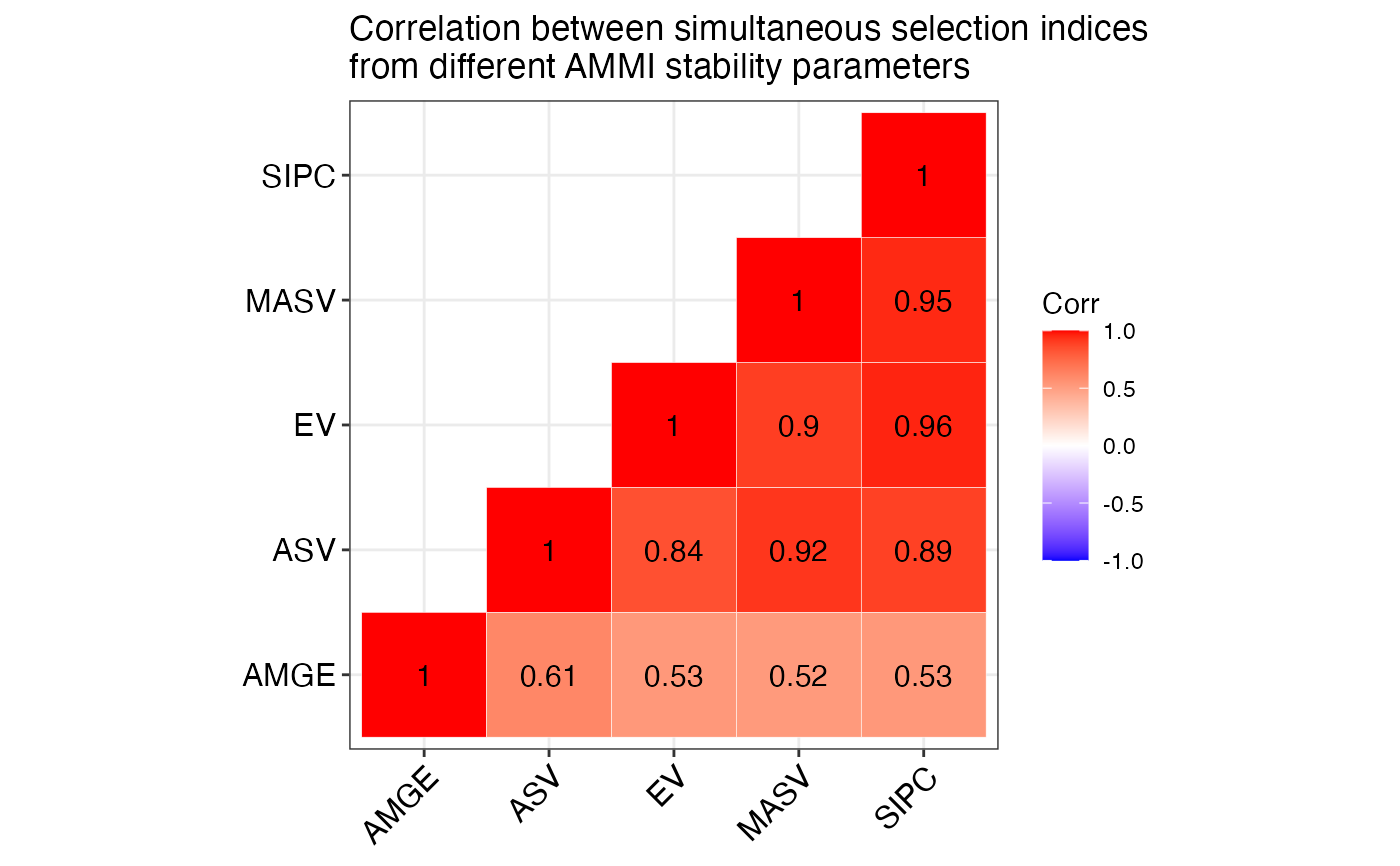
- SSI Correlogram
Correlogram of SSIs.
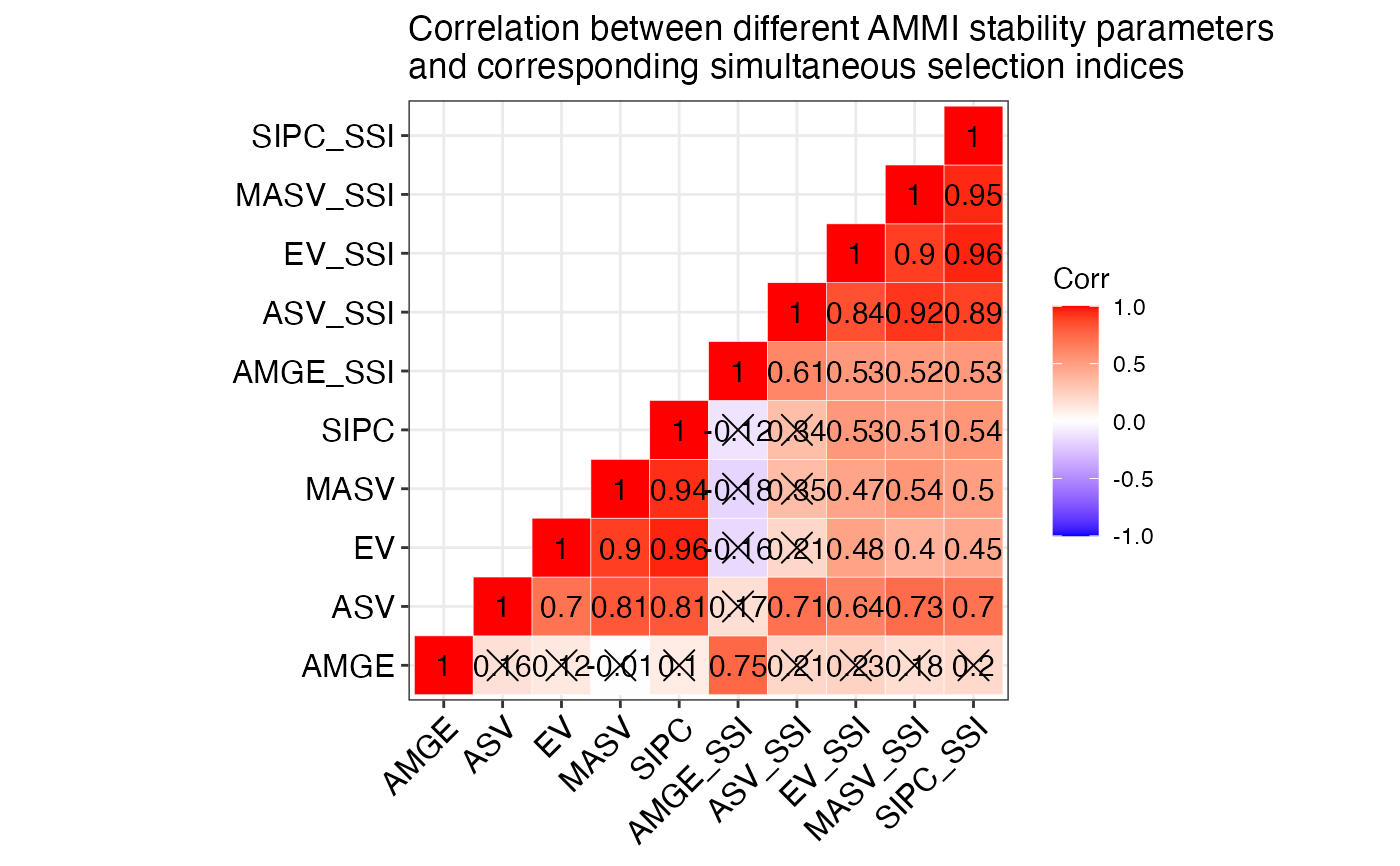
- SP and SSI Correlogram
Correlogram of stability parameters and SSIs.
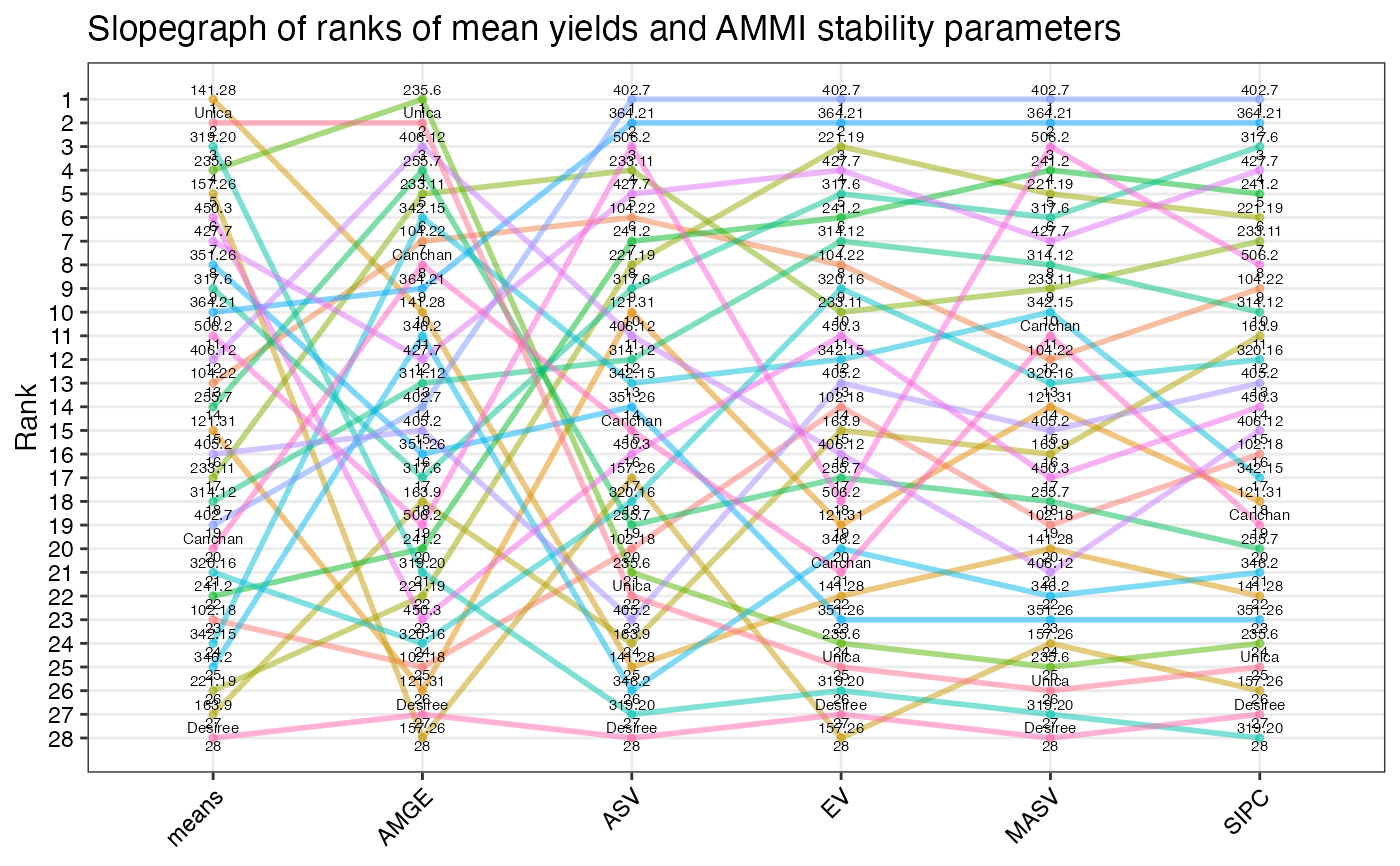
- SP Slopegraph
Slopegraph of stability parameter ranks.
- SSI Slopegraph
Slopegraph of SSI ranks.
- SP Heatmap
Heatmap of stability parameter ranks.
- SSI Heatmap
Heatmap of SSI ranks.
Details
ammistability computes the following stability parameters from an AMMI
model.
- Sum Across Environments of GEI Modelled by AMMI (AMGE)
Sneller et al. (1997)
- AMMI Stability Index (ASI)
Jambhulkar et al. (2014); Jambhulkar et al. (2015); Jambhulkar et al. (2017)
- AMMI Stability Value (ASV)
Purchase (1997); Purchase et al. (1999); Purchase et al. (2000)
- AMMI Based Stability Parameter (ASTAB)
Rao and Prabhakaran (2005)
- Sum Across Environments of Absolute Value of GEI Modelled by AMMI (AVAMGE)
Zali et al. (2012)
- Annicchiarico's D Parameter (DA)
Annicchiarico (1997)
- Zhang's D Parameter (DZ)
Zhang et al. (1998)
- Averages of the Squared Eigenvector Values (EV)
Zobel (1994)
- Stability Measure Based on Fitted AMMI Model (FA)
Raju (2002)
- Modified AMMI Stability Index (MASI)
Ajay et al. (2018)
- Modified AMMI Stability Value (MASV)
Zali et al. (2012); Ajay et al. (2019)
- Sums of the Absolute Value of the IPC Scores (SIPC)
Sneller et al. (1997)
- Absolute Value of the Relative Contribution of IPCs to the Interaction (Za)
Zali et al. (2012)
References
Ajay BC, Aravind J, Abdul Fiyaz R, Bera SK, Kumar N, Gangadhar K, Kona P (2018).
“Modified AMMI Stability Index (MASI) for stability analysis.”
ICAR-DGR Newsletter, 18, 4–5.
Ajay BC, Aravind J, Fiyaz RA (2019).
“ammistability: R package for ranking genotypes based on stability parameters derived from AMMI model.”
Indian Journal of Genetics and Plant Breeding (The), 79(2), 460–466.
Annicchiarico P (1997).
“Joint regression vs AMMI analysis of genotype-environment interactions for cereals in Italy.”
Euphytica, 94(1), 53–62.
Jambhulkar NN, Bose LK, Pande K, Singh ON (2015).
“Genotype by environment interaction and stability analysis in rice genotypes.”
Ecology, Environment and Conservation, 21(3), 1427–1430.
Jambhulkar NN, Bose LK, Singh ON (2014).
“AMMI stability index for stability analysis.”
In Mohapatra T (ed.), CRRI Newsletter, January-March 2014, volume 35(1), 15.
Central Rice Research Institute, Cuttack, Orissa.
Jambhulkar NN, Rath NC, Bose LK, Subudhi HN, Biswajit M, Lipi D, Meher J (2017).
“Stability analysis for grain yield in rice in demonstrations conducted during rabi season in India.”
Oryza, 54(2), 236–240.
Purchase JL (1997).
Parametric analysis to describe genotype × environment interaction and yield stability in winter wheat.
Ph.D. Thesis, University of the Orange Free State.
Purchase JL, Hatting H, van Deventer CS (1999).
“The use of the AMMI model and AMMI stability value to describe genotype x environment interaction and yield stability in winter wheat (Triticum aestivum L.).”
In Proceedings of the Tenth Regional Wheat Workshop for Eastern, Central and Southern Africa, 14-18 September 1998.
University of Stellenbosch, South Africa.
Purchase JL, Hatting H, van Deventer CS (2000).
“Genotype × environment interaction of winter wheat (Triticum aestivum L.) in South Africa: II. Stability analysis of yield performance.”
South African Journal of Plant and Soil, 17(3), 101–107.
Raju BMK (2002).
“A study on AMMI model and its biplots.”
Journal of the Indian Society of Agricultural Statistics, 55(3), 297–322.
Rao AR, Prabhakaran VT (2005).
“Use of AMMI in simultaneous selection of genotypes for yield and stability.”
Journal of the Indian Society of Agricultural Statistics, 59, 76–82.
Sneller CH, Kilgore-Norquest L, Dombek D (1997).
“Repeatability of yield stability statistics in soybean.”
Crop Science, 37(2), 383–390.
Zali H, Farshadfar E, Sabaghpour SH, Karimizadeh R (2012).
“Evaluation of genotype × environment interaction in chickpea using measures of stability from AMMI model.”
Annals of Biological Research, 3(7), 3126–3136.
Zhang Z, Lu C, Xiang Z (1998).
“Analysis of variety stability based on AMMI model.”
Acta Agronomica Sinica, 24(3), 304–309.
Zobel RW (1994).
“Stress resistance and root systems.”
In Proceedings of the Workshop on Adaptation of Plants to Soil Stress. 1-4 August, 1993. INTSORMIL Publication 94-2, 80–99.
Institute of Agriculture and Natural Resources, University of Nebraska-Lincoln.
Examples
library(agricolae)
data(plrv)
# AMMI model
model <- with(plrv, AMMI(Locality, Genotype, Rep, Yield, console = FALSE))
ammistability(model, AMGE = TRUE, ASI = FALSE, ASV = TRUE, ASTAB = FALSE,
AVAMGE = FALSE, DA = FALSE, DZ = FALSE, EV = TRUE,
FA = FALSE, MASI = FALSE, MASV = TRUE, SIPC = TRUE,
ZA = FALSE)
#> Warning: `aes_string()` was deprecated in ggplot2 3.0.0.
#> ℹ Please use tidy evaluation idioms with `aes()`.
#> ℹ See also `vignette("ggplot2-in-packages")` for more information.
#> ℹ The deprecated feature was likely used in the ggcorrplot package.
#> Please report the issue at <https://github.com/kassambara/ggcorrplot/issues>.
#> Warning: Using `size` aesthetic for lines was deprecated in ggplot2 3.4.0.
#> ℹ Please use `linewidth` instead.
#> ℹ The deprecated feature was likely used in the ammistability package.
#> Please report the issue at <https://github.com/ajaygpb/ammistability/issues>.
#> $Details
#> $Details$`Stability parameters estimated`
#> [1] "AMGE" "ASV" "EV" "MASV" "SIPC"
#>
#> $Details$`SSI method`
#> [1] "Farshadfar (2008)"
#>
#>
#> $`Stability Parameters`
#> genotype means AMGE ASV EV MASV SIPC
#> 1 102.18 26.31947 -5.329071e-15 3.3801820 0.0232206231 4.7855876 2.9592568
#> 2 104.22 31.28887 1.776357e-15 1.4627695 0.0175897578 3.8328358 2.2591593
#> 3 121.31 30.10174 8.881784e-16 2.2937918 0.0342010876 4.0446758 3.3872806
#> 4 141.28 39.75624 3.552714e-15 4.4672401 0.0529036285 5.1867706 4.3846248
#> 5 157.26 36.95181 -2.664535e-15 3.2923168 0.0965635719 7.6459224 5.4846596
#> 6 163.9 21.41747 -5.329071e-15 4.4269636 0.0236900961 4.4977055 2.6263670
#> 7 221.19 22.98480 -2.220446e-15 1.8014494 0.0127574566 2.1905344 2.0218098
#> 8 233.11 28.66655 2.553513e-15 1.0582263 0.0211138628 3.1794345 2.1624442
#> 9 235.6 38.63477 3.552714e-15 3.7647078 0.0723274691 8.4913020 4.8273551
#> 10 241.2 26.34039 -1.998401e-15 1.6774241 0.0153823821 2.0338659 2.0056410
#> 11 255.7 30.58975 -1.776357e-15 3.3289736 0.0317506280 4.7013868 3.6075128
#> 12 314.12 28.17335 3.552714e-15 2.9170536 0.0170302467 3.1376678 2.4584089
#> 13 317.6 35.32583 2.664535e-15 2.1874274 0.0136347120 2.3345492 1.8698826
#> 14 319.20 38.75767 7.105427e-15 6.7164864 0.0855988994 8.6398087 5.9590451
#> 15 320.16 26.34808 -1.776357e-15 3.3208950 0.0180662044 3.8822326 2.7040109
#> 16 342.15 26.01336 -1.776357e-15 2.9219360 0.0225156118 3.6438425 2.9755899
#> 17 346.2 23.84175 -5.329071e-15 5.1827747 0.0459434537 5.3987165 3.9525017
#> 18 351.26 36.11581 2.220446e-15 2.9786832 0.0639652186 5.4005468 4.5622439
#> 19 364.21 34.05974 1.221245e-15 0.7236998 0.0018299284 1.4047546 0.7526264
#> 20 402.7 27.47748 -3.330669e-16 0.2801470 0.0001339385 0.3537818 0.2284995
#> 21 405.2 28.98663 -2.664535e-15 3.9832546 0.0229492190 4.1095727 2.7952381
#> 22 406.12 32.68323 3.552714e-15 2.5631734 0.0264692745 5.3218165 2.8834753
#> 23 427.7 36.19020 3.552714e-15 1.1467970 0.0135698145 2.4124676 2.0049278
#> 24 450.3 36.19602 1.776357e-15 3.1430174 0.0216161656 4.6608954 2.8200387
#> 25 506.2 33.26623 -7.632783e-16 0.7511331 0.0318266934 1.9330143 2.2178470
#> 26 Canchan 27.00126 3.996803e-15 3.0975884 0.0461305761 3.6665608 3.5328212
#> 27 Desiree 16.15569 -1.243450e-14 7.7833445 0.0901534938 9.0626072 5.8073242
#> 28 Unica 39.10400 8.881784e-15 3.8380782 0.0770659860 8.5447632 5.0654615
#>
#> $`Simultaneous Selection Indices`
#> genotype means AMGE_SSI ASV_SSI EV_SSI MASV_SSI SIPC_SSI
#> 1 102.18 26.31947 26.0 43 37 42 39
#> 2 104.22 31.28887 29.5 19 21 25 22
#> 3 121.31 30.10174 29.0 25 34 29 33
#> 4 141.28 39.75624 24.0 26 23 21 23
#> 5 157.26 36.95181 10.5 22 33 29 31
#> 6 163.9 21.41747 30.0 51 42 43 38
#> 7 221.19 22.98480 33.0 34 29 31 32
#> 8 233.11 28.66655 36.0 21 27 26 24
#> 9 235.6 38.63477 27.0 25 28 29 28
#> 10 241.2 26.34039 30.0 29 28 26 27
#> 11 255.7 30.58975 24.0 33 31 32 34
#> 12 314.12 28.17335 41.0 30 25 26 28
#> 13 317.6 35.32583 29.0 18 14 15 12
#> 14 319.20 38.75767 30.0 30 29 30 31
#> 15 320.16 26.34808 31.0 39 30 34 33
#> 16 342.15 26.01336 34.0 37 36 34 41
#> 17 346.2 23.84175 28.0 51 45 47 46
#> 18 351.26 36.11581 26.0 22 31 31 31
#> 19 364.21 34.05974 25.0 12 12 12 12
#> 20 402.7 27.47748 32.0 20 20 20 20
#> 21 405.2 28.98663 21.5 39 29 31 29
#> 22 406.12 32.68323 35.0 23 28 33 27
#> 23 427.7 36.19020 30.0 12 11 14 11
#> 24 450.3 36.19602 22.5 22 17 23 20
#> 25 506.2 33.26623 23.0 14 29 14 19
#> 26 Canchan 27.00126 46.0 35 41 31 39
#> 27 Desiree 16.15569 29.0 56 55 56 55
#> 28 Unica 39.10400 30.0 24 27 28 27
#>
#> $`SP Correlation`
#> AMGE ASV EV MASV SIPC
#> AMGE 1.00** <NA> <NA> <NA> <NA>
#> ASV -0.28 1.00** <NA> <NA> <NA>
#> EV 0.03 0.70** 1.00** <NA> <NA>
#> MASV 0.01 0.81** 0.90** 1.00** <NA>
#> SIPC 0.01 0.81** 0.96** 0.94** 1.00**
#>
#> $`SSI Correlation`
#> AMGE ASV EV MASV SIPC
#> AMGE 1.00** <NA> <NA> <NA> <NA>
#> ASV 0.14 1.00** <NA> <NA> <NA>
#> EV 0.11 0.84** 1.00** <NA> <NA>
#> MASV 0.09 0.92** 0.90** 1.00** <NA>
#> SIPC 0.14 0.89** 0.96** 0.95** 1.00**
#>
#> $`SP and SSI Correlation`
#> AMGE ASV EV MASV SIPC AMGE_SSI ASV_SSI EV_SSI MASV_SSI
#> AMGE 1.00** <NA> <NA> <NA> <NA> <NA> <NA> <NA> <NA>
#> ASV -0.28 1.00** <NA> <NA> <NA> <NA> <NA> <NA> <NA>
#> EV 0.03 0.70** 1.00** <NA> <NA> <NA> <NA> <NA> <NA>
#> MASV 0.01 0.81** 0.90** 1.00** <NA> <NA> <NA> <NA> <NA>
#> SIPC 0.01 0.81** 0.96** 0.94** 1.00** <NA> <NA> <NA> <NA>
#> AMGE_SSI 0.26 -0.10 -0.30 -0.26 -0.25 1.00** <NA> <NA> <NA>
#> ASV_SSI -0.68** 0.71** 0.21 0.35 0.34 0.14 1.00** <NA> <NA>
#> EV_SSI -0.62** 0.64** 0.48** 0.47* 0.53** 0.11 0.84** 1.00** <NA>
#> MASV_SSI -0.63** 0.73** 0.40* 0.54** 0.51** 0.09 0.92** 0.90** 1.00**
#> SIPC_SSI -0.60** 0.70** 0.45* 0.50** 0.54** 0.14 0.89** 0.96** 0.95**
#> SIPC_SSI
#> AMGE <NA>
#> ASV <NA>
#> EV <NA>
#> MASV <NA>
#> SIPC <NA>
#> AMGE_SSI <NA>
#> ASV_SSI <NA>
#> EV_SSI <NA>
#> MASV_SSI <NA>
#> SIPC_SSI 1.00**
#>
#> $`SP Correlogram`
 #>
#> $`SSI Correlogram`
#>
#> $`SSI Correlogram`
 #>
#> $`SP and SSI Correlogram`
#>
#> $`SP and SSI Correlogram`
 #>
#> $`SP Slopegraph`
#>
#> $`SP Slopegraph`
 #>
#> $`SSI Slopegraph`
#>
#> $`SSI Slopegraph`
 #>
#> $`SP Heatmap`
#>
#> $`SP Heatmap`
 #>
#> $`SSI Heatmap`
#>
#> $`SSI Heatmap`
 #>
#>